
How to Look Up Richland County Jail Population Data
Richland County does not publish a single live population dashboard, so the data lives across a few official documents. County detention committee agenda packets include jail population tables, and a July 22, 2025 packet listed an average daily population. The county budget information page and the FY 2026 recommended budget book hold detention spending detail. A U.S. Department of Justice findings report gives capacity figures.
Read these sources by date, since the population shifts month to month. Capacity is a fixed rated number, while average daily population is an estimate that changes. Some figures are exact counts from county packets; others are approximate ranges from county employment material. When numbers differ, the most recent official county document usually carries the most weight.
It helps to know what each figure means before you compare them. A rated capacity is the number of beds the facility is built to hold. An average daily population is the mean count over a stated period, which smooths out daily swings. A point-in-time count is just one day's snapshot. Mixing these can be misleading, so note which kind of number a document reports before you draw a conclusion about crowding.
Richland County Jail Capacity Overview
The county's only main facility is the Alvin S. Glenn Detention Center at 201 John Mark Dial Drive. The DOJ findings report listed a total rated capacity of 1,120 as of December 2024. County employment material describes a daily population of roughly 750 to 1,100, and a July 2025 detention packet showed an average daily population of 908. Bond Court shares the same address but is not a housing unit.
| Facility | Rated Capacity | Population Figures Located |
|---|---|---|
| Alvin S. Glenn Detention Center | 1,120 (Dec. 2024) | Approx. 750-1,100 daily; July 2025 ADP 908 |
The capacity figure is county-specific and comes from the federal findings report; the daily ranges come from county materials.
Average Daily Population
Average daily population, or ADP, is the mean number of people held across a period. The most specific county figure located is an ADP category total of 908 from a July 2025 detention agenda packet. County employment material frames the broader daily population at roughly 750 to 1,100 people. Against a rated capacity of 1,120, an ADP near 908 suggests the facility runs busy but below its rated ceiling.
ADP is the better gauge of day-to-day load than a single snapshot, because the count rises and falls with arrests, bond decisions, and transfers. A precise month-by-month ADP series was not published in the pages reviewed, so treat the 908 figure as a recent point rather than a long trend line.
Key Richland County Jail Figures
The table below pulls together the official figures located, with the source noted for each. These are the numbers to cite when describing the Richland County jail population.
| Metric | Value |
|---|---|
| Rated capacity | 1,120 as of December 2024 (DOJ report) |
| Approximate daily population | 750 to 1,100 (county employment material) |
| July 2025 average daily population | 908 (county detention packet) |
| County population served | More than 400,000 (DOJ report) |
| Facility construction | Built in five phases, 1994 to 2005 |
Demographic Breakdown
A detailed demographic breakdown by age, race, and sex was not published in the county pages reviewed. Because inventing those figures would mislead, this page does not list percentages that the county has not released. For a demographic profile, the DOJ Civil Rights Division findings report and county detention committee packets are the best official starting points.
The detention center does house both adults and a range of custody levels, and it states that care quality stays equal regardless of where a person is in the process. Anyone who needs a current demographic count should request it through the county FOIA channel rather than rely on an unofficial estimate.
Pretrial vs. Sentenced Population
The Alvin S. Glenn Detention Center holds two broad groups: adults waiting for a trial or court date, who are unsentenced, and adults serving time after sentencing for misdemeanors or felonies. That mix is typical of a county jail, which differs from a state prison that holds sentenced inmates only.
An exact pretrial-to-sentenced ratio was not located in the official pages reviewed, so this page does not assign a percentage to each group. Bond Court decisions drive the pretrial share, since the speed of bond and case resolution affects how many people wait in custody. The county also supports alternatives to jail for low-risk people, which can shift the balance.
Misdemeanor vs. Felony Population
The jail holds people charged with or convicted of both misdemeanors and felonies. Felony and serious cases run through General Sessions, while lower-level matters sit in Magistrate or Municipal Court. A precise split between misdemeanor and felony detainees was not published in the county pages reviewed.
Because charge level affects bond and sentence length, it also affects how long a person stays. Felony detainees often remain longer, which can weigh the average population toward serious cases even when more people are booked on lower charges.
Mental Health and Medical Population
Jails carry a share of people with mental health and medical needs, and the DOJ investigation of Alvin S. Glenn examined conditions at the facility. The county frames its LEAD deflection program as a way to redirect people whose conduct stems from unmet behavioral health needs, rather than cycling them through jail and court. A specific count of detainees receiving mental health or medical care was not published in the pages reviewed.
National and State Context
National jail data is tracked by the federal Bureau of Justice Statistics and by research groups such as the Vera Institute, which report local jail populations per 100,000 residents. A confirmed county, state, and national per-100,000 comparison for Richland was not available in the sources reviewed, so this page does not publish a comparison table with estimated rates.
For scale, the DOJ report notes Richland County's population is more than 400,000, served by a single jail with a rated capacity of 1,120. Anyone needing a per-capita comparison should pull the current BJS jail report and the county's own population figure rather than rely on an unofficial rate.
Population Trends Over Time
The available data points sketch a short trend rather than a long series. DOJ and news summaries indicate that population, violence, and staffing concerns escalated from 2022 through 2024, leading to a DOJ investigation that produced findings in January 2025. The report listed a rated capacity of 1,120 as of December 2024. A July 2025 county packet then showed an average daily population of 908.
Into 2026, the county has continued to emphasize alternatives to jail, such as community service and electronic monitoring for low-risk people, to ease crowding. A full year-by-year population chart was not published in the pages reviewed, so the figures above are best read as recent reference points. To build a trend of your own, pull the population table from each county detention packet over several months and line up the average daily population figures by date.
DOJ Findings and Jail Conditions
The most significant recent review of the facility came from the federal government. In January 2025, the U.S. Department of Justice Civil Rights Division issued findings after investigating the Alvin S. Glenn Detention Center. The report describes the current structure as built in five phases between 1994 and 2005 and lists a rated capacity of 1,120 as of December 2024. The investigation followed years of reported concern about population pressure, violence, and staffing at the jail.
That federal report is the single most detailed public source on the facility's capacity and conditions. It is the right document to cite for capacity, construction history, and the population context the county serves. County detention committee packets then add the month-to-month operational figures, such as the July 2025 average daily population.
Jail Alternatives and Crowding Response
The county has responded to population pressure with alternatives to jail. Its detention page states that Richland County supports options besides jail when safe and appropriate, including community service or electronic monitoring, especially for low-risk individuals. The county frames these as ways to reduce crowding while helping people stay connected to jobs, families, and support.
The Sheriff's Department LEAD deflection program works in the same direction at the front end, by redirecting some people with behavioral health needs away from repeated arrest and detention. Together, these efforts can shift the daily population, which is one reason a single snapshot count is less useful than an average over time.
Searching for Richland County Inmate Records by Name
This page covers aggregate jail population data, not individual lookups. To search for a specific person held now, use the live jail roster on the Richland County inmate records page, which runs a name-based custody search. Population figures and individual custody records are separate kinds of data.
Where the Data Comes From
The figures here trace to a few official sources. The U.S. Department of Justice Civil Rights Division findings report supplies the rated capacity and the construction history. County detention committee agenda packets supply the average daily population. The county budget materials supply detention spending context. National context comes from the Bureau of Justice Statistics and the Vera Institute, which publish jail trends and per-capita rates for the country and for states.
The Richland County budget information page is shown below.
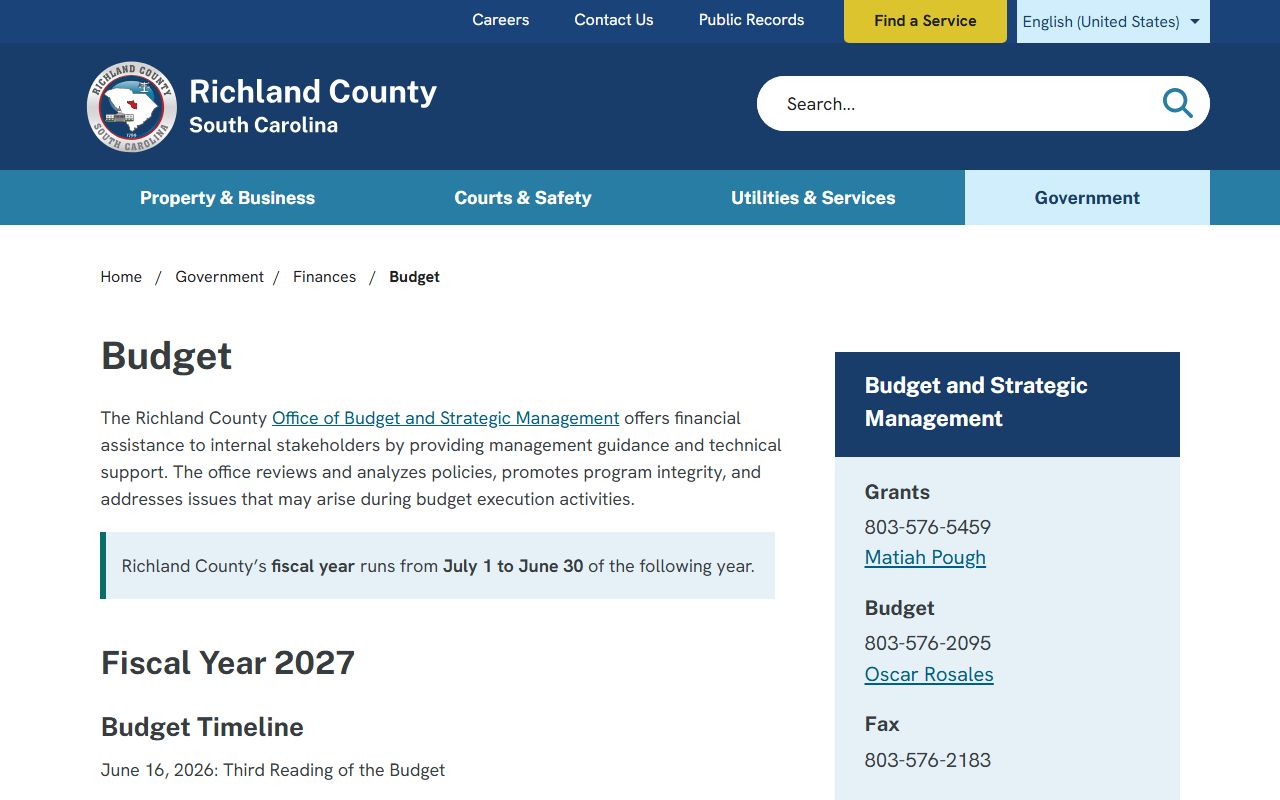
Use the county budget page and the FY 2026 budget book for detention spending, and the DOJ report for capacity figures.